Ideas for Day Trading
Carpe diem ("seize the day") is the aphorism from Horace, the Latin poet of the first century BC. He was referring to the fact that in his time it was better to enjoy the moment rather than hope for some future benefit.
If you have the opportunity of spending part of your day in front of a screen analyzing quotes and charts, day trading is a way to simplify your life, because in most cases it is safe from sometimes news – and surprises – that are typically announced after the market close. In other words, carpe diem is really the currency of day trading. In contrast, the inter-day investor introduces the concept of time, of tomorrow, to dilute the risk of their positions (if the price is moving against them right now they hope that the trend will be reversed later).
Day trading is an activity where tools that identify when to buy and sell are similar to those of the inter-day trading, except for some specific criteria. Among these is volume.
Since the trader works in very short periods, usually two minutes, they must ensure that in each period there is consistently enough liquidity; trading volume to make a purchase and immediate sale, without disrupting the market. This means that the number of daily transactions in the market should be high. Below are three examples of liquidity.
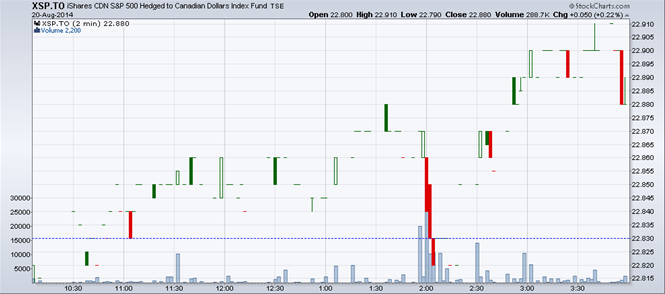
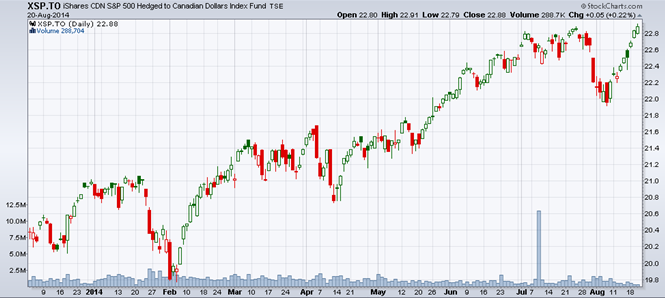
A — Charts 1 and 2 show the American S&P500 index using a Canadian Dollar ETF (XSP.TO)
Chart 2 shows the progress of XSP.TO prices and the corresponding volume of each session over several months (between December 2013 and August 2014). Note that the average daily volume is between 0.5 and 1 million shares traded (see bottom of chart). This is very good for the Canadian market in general.
Chart 1 shows the XSP.TO only during the last session of Chart 2, divided into periods of two minutes. We can easily see that the session volume is distributed very unevenly: often there is only one trade (a small horizontal line). We see a few candles, indicating more than one trade. Several 2-minute periods show no trades at all.
A trading session consists of 195 periods of two minutes each (each regular session from 9:30am to 4pm has a total of 6 hours and 30 minutes of trading or 195 times two minutes). An average volume of 750,000 shares traded per session, divided by 195 periods is a little less than 4,000 shares per 2-minute period. Chart 1 shows that this volume is not adequate for day trading. The XSP, despite its sizable daily volume is not recommended for day trading because we risk being the only one to trade in a given period, alone against the market maker due to the lack of competition among investors. This usually generates a worse price than could normally be obtained when many participants are in the market at the same time.
If we want to give a score between 1 (= worst) and 5 (= best) to day trading XSP.TO, it would be a meagre 1.
 Source : Stockcharts
 Source : Stockcharts
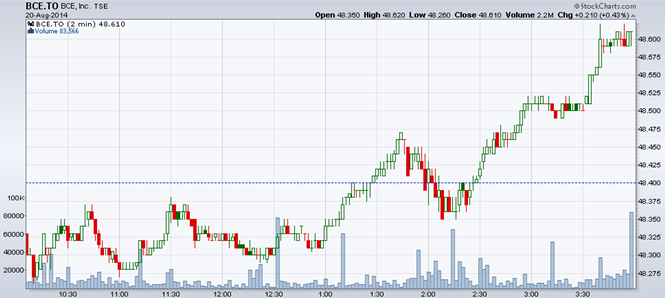
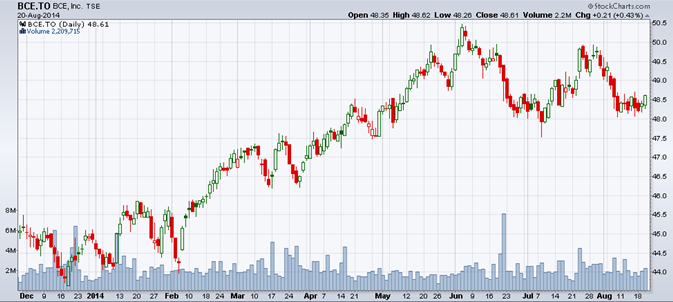
B – Charts 3 and 4 show BCE.TO
In Chart 4 (BCE from December 2013 to August 2014) shows that the average daily volume is about 2 million shares traded. This volume divided by 195 two-minute periods is an average of slightly more than 10,000 shares for every two minutes. Chart 3 shows that there are trades in every two-minute period. This is considerably better than the XSP.TO. However, this chart also shows that there are groups of slow periods, for example, between 11:00 and 11:10am or between 2:56 and 3:30pm, or in stages between 1:00 and 1:30pm. These indicate a drop in volume. It is obvious that the average volume is just that, and that each period can have more or less volume than the average. But here, the "less" is quite low; so that only two trades, for example, can create a bar (for a bar to be created, only two trades at two different prices need to be filled).
If we want to give a score between 1 (= worst) and 5 (= best) to day trading BCE.TO, it would be a neutral 2.5.
 Source : Stockcharts
 Source : Stockcharts
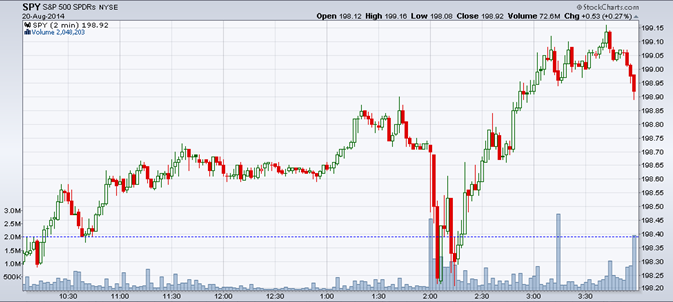
C - Charts 5 and 6 show the American S&P500 index using a US Dollar ETF, as traded on the NYSE (SPY)
Among US ETFs, the volume on the SPY is the highest. This is an extreme case of good liquidity. Chart 6 shows an average daily volume of about 100 million shares. Dividing this by 195 gives a volume of about 0.5 million shares traded per two-minute period. Looking at Chart 6, the price behaviour is similar to that of Chart 5. This is an indication of high volume during all periods throughout the session.
If we want to give a score between 1 (= worst) and 5 (= best) to day trading SPY, it would absolutely be a 5.
 Source : Stockcharts
(Note - The blue horizontal dashed line in Charts 1, 3 and 5 indicates the closing price of the previous session.)
 Source : Stockcharts
Clearly the day trader's main concern is to select stocks or ETFs that allow them to buy or sell instantly. This is ensured by a significantly high and consistent volume throughout the session.
They also require that each intraday period include a multiple of trades, for example at least 20 times the number of shares or ETF units that the day trader wants to trade with their capital.