Improved Economic Conditions Pave the Way for Higher Canadian Key Interest Rates
Euro zone first quarter results exceeded expectations. That performance, along with the positive state of several indicators lead to an upgrade of the forecast for 2017 real GDP growth. The opposite is happening in the United Kingdom, where they are starting to feel the negative effects of the Brexit decision, and the Conservative government was weakened in the recent election. Emerging economies are showing rather positive signs. The forecast for global real GDP has risen from 3.3% to 3.4% for 2017, and remains at 3.5% for 2018.
In the United States, growth was relatively disappointing during the first quarter of 2017 but should pick up again in the spring despite lower-than-expected results from some indicators. Business investment in particular seems to be more solid. We have changed our assumptions about the extent of the policies the Trump administration could introduce, because the administration is having a hard time pushing its programs through. Our forecast for real GDP growth for 2017 was increased slightly to 2.3%, with 2.4% expected for 2018.
The Canadian economy has had the wind at its back since mid-2016. After gains of 4.2% and 2.7% (annualized) in the third and fourth quarters of 2016 respectively, real GDP grew 3.7% in the first quarter of 2017. Even though risks remain, growth forecasts for the Canadian economy are quite good for 2017, with an expected gain of 2.6% in real GDP. We are still forecasting 2.0% growth for 2018.
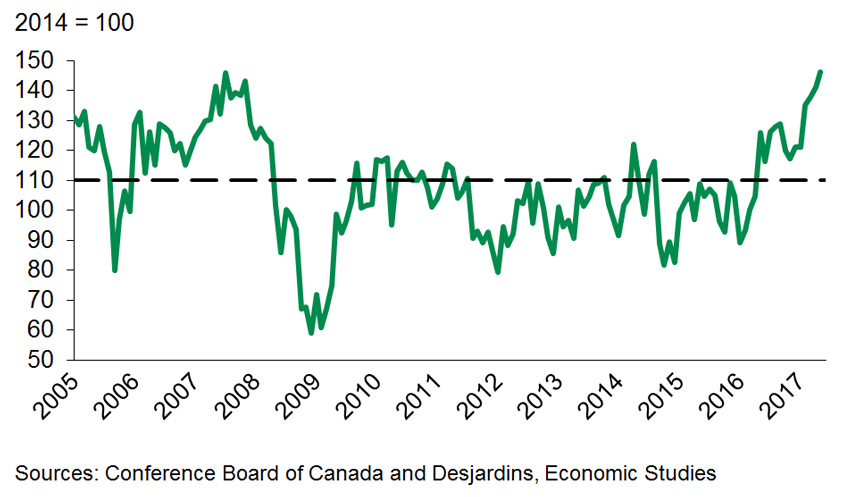
In Quebec, 2017 started on a positive note (Graph 1). Retail sales remained strong and the residential real estate market shifted into second gear. Signals from businesses are less encouraging: international exports faltered during the first quarter and private investment failed to rally. However, the many public infrastructure projects are bolstering economic activity. Real GDP growth should be around 2.0% in 2017. We expect a slower pace of 1.5% next year, as consumer spending should slow down.
In the other provinces, economic growth should be more geographically diversified in 2017 and 2018. While there should be a sustained growth of real GDP in Ontario and British Columbia, stabilization of the energy sector will allow oil-producing provinces like Alberta, Saskatchewan and Newfoundland and Labrador to rebound and enjoy economic growth approaching the national average. The Maritime provinces may continue to lag behind a bit, mainly due to their lower demographics-based potential.
Long-term bond yields continued to decline, reflecting weak oil prices, among other things. Nonetheless, the Federal Reserve (Fed) increased its key interest rates for the third quarter in a row in June, and is staying the course for another increase this year and three 0.25% increases next year, as we forecast. Some concern about the latest inflation figures could, however, prompt the Fed to wait until December rather than September before raising its key rates again.
Other central banks have adopted a more positive tone, reassured by how well the global economy is performing. The European Central Bank is no longer considering lowering its rates further, and three of the eight members of U.K.’s Monetary Policy Committee voted for higher rates in June.
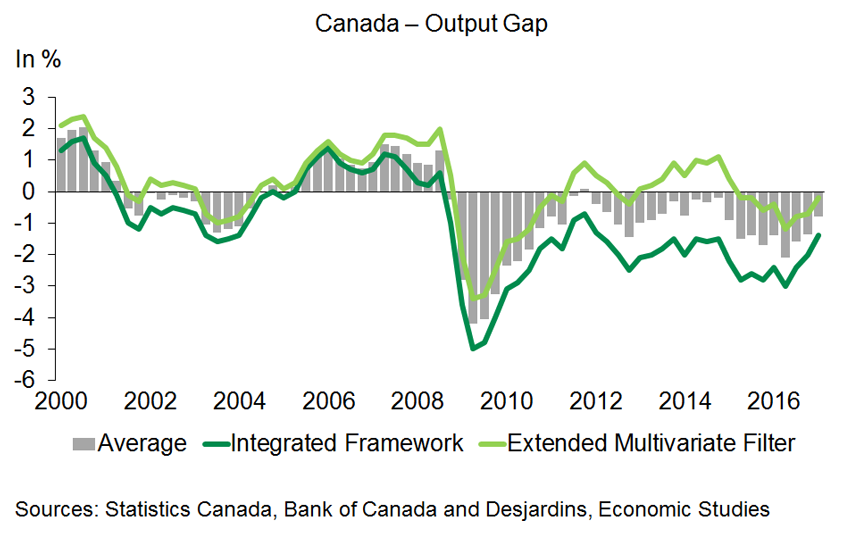
The change in tone is particularly noticeable particularly in Canada, propelling the Loonie and bond yields upwards. Now that doubts about the sturdiness of the Canadian recovery are starting to wane and excess capacity is shrinking (Graph 2), the Bank of Canada is openly wondering whether the two rate reductions of 2015 should be reversed. We now forecast a 0.25% increase in Canadian key rates in October, without ruling out action as early as July.
Under these circumstances, the Canadian dollar should hover around US$0.75, even though the U.S. dollar could appreciate against most other currencies.