Take the Pulse of Financial Markets with the Morningstar Heat Map!
Launched in 2017, the Morningstar Heat Map is a tool that efficiently shows market fluctuations in a unique graphic format.
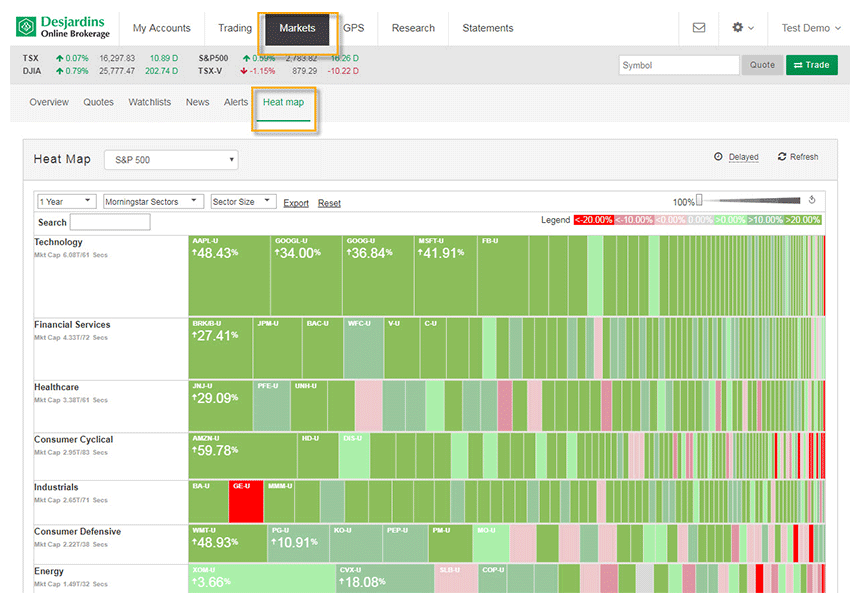
Select one of the available North American markets such as the TSX, Dow Jones, Nasdaq or S&P 500, and view the security fluctuations from 11 sectors, including technology, financial services and health care. You can also see the performance of major companies in each industry, which are organized by their respective market capitalization.
What's more, the legend can display a range of colors to clearly show variations in each security. Customize the trading interval between one day and one year. With this heat map, establishing the major winners and losers becomes child's play!
Discover this new indispensable tool in the "Markets" section of your account to seize available market opportunities!