The Four Musketeers of Technical Analysis
In the stock market, there are several theories about making money. Among these theories, there are those that seem to lack a clear and logical relationship between cause and effect, but they remain popular. For example, the Super Bowl theory says that if the NFL wins over the AFC in the beginning of the year, market indices will rise during the year. On the other hand, if the AFC wins it will be a bad year for the markets. Does this make sense? Well, it is enough for some believe that there is a relationship between the cause and effect of this theory.
Another of these theories says that since 1950, the market has made gains between November and April and suffered setbacks between May and October ("Sell in May and go away"). Is this theory any good? Many believe it.
Yet another theory says that when the year ends with 5 (for example, 2015) and it is the sixth year in office for an American president (this year), the stock markets will necessarily rise. These are coincidences, however many, that may sometimes lead one to believe that these relationships of cause and effect really exist. In its introduction, the popular Stock Trader's Almanac 2015 also mentions this theory, pointing out that the opposite has rarely happened. However, the logic of its cause and effect is difficult to find.
Portfolios are based on probabilities that indices will rise, taking into account the behaviour of the past 20 years. For example, if the Standard & Poor 500 index rises in previous years on June 20, there is theoretically a 67% chance that the same thing happens on the same date the following year. This probability theory has no logical basis, but it has generated profit for many.
Twenty years ago the lunar cycle theory was fashionable with regard to the behavior of the price of gold. After a full moon, the gold price fell and then continued to rising during the following phases. The start of each phase was a highlight for the price movement.
Another, more recent theory claims that the increased consumption of butter in emerging countries was accompanied by a rise in North American indices. Several theories were born thanks to "data mining": stock index data is entered into a computer and correlations are sought, for example, with the consumption of Aspirin. It was noted that often, when consumption increases, the market goes down.
Unlike these "theories" that produce doubts about their reliability to generate profit, there are market indicators that work well and provide good results. The best by tradition is the RSI (Relative Strength Index by Wilder), Stochastic, MACD (Moving Average Convergence Divergence) and the CCI (Commodity Channel Index). These are the four "musketeers" of technical analysis: the most credible and sensible and therefore helpful for us to take advantage of market movements. These indicators have always been around in various forms; their design is ancient and their effectiveness has been proven. Naturally, many other indicators exist, but they are very often imitations with different names.
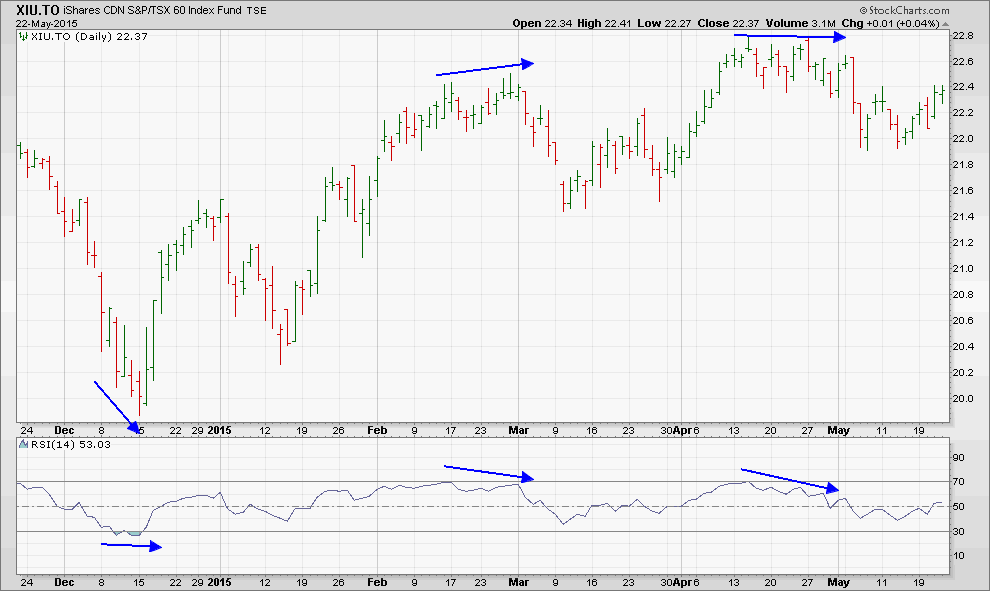
The RSI is good for giving us a signal of "fatigue" in the current market trend, which helps predict a reversal. Chart 1 (XIU.to) shows this: the three arrows indicate a divergence in the RSI from that of the price chart. Note that when a divergence exists, the RSI predicts a change in direction of XIU.to. Prudence dictates that it should not be used as an indicator for buying and selling or, at most, used for a small part of the amount available to invest. This is because its formula does not sufficiently provide a clear and decisive signal, but rather symptoms that a change in price direction is imminent.
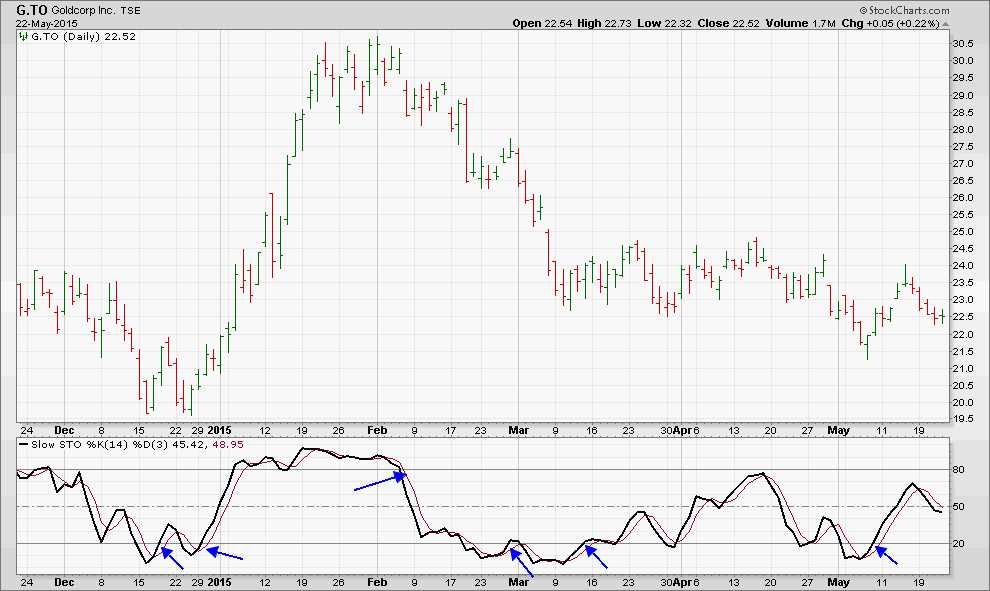
Stochastic (see Chart 2 - Goldcorp) is based on the pendulum principle: when a price reaches an extreme in its momentum (Stochastic higher than 80%), it turns around. If the Stochastic falls below 20%, it tends to bounce back because it has temporarily reached its extreme downward momentum. Stochastic is good, but it is more reactive than the MACD and CCI. The safest use of this tool is for exit signals rather than entries. As the arrows show, the signals are triggered for small as well as big changes in direction. It is a tool that should be used with filters; that is to say, with other tools to confirm or contradict the signal's ability to potentially provide a profit.
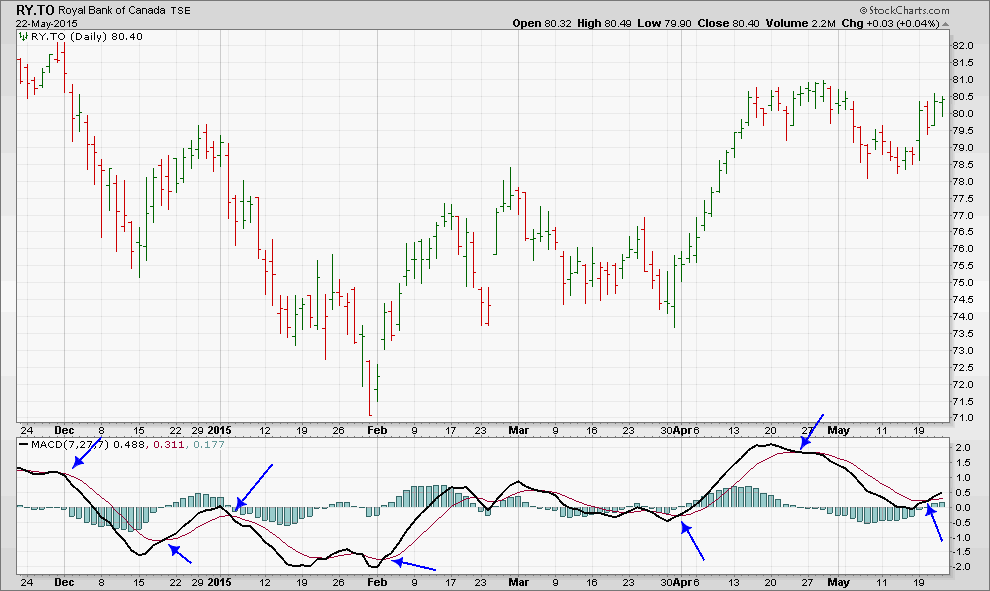
MACD (Chart 3 - Royal Bank) measures the distance of two exponential moving price averages (EMA); one slow and one fast. An increasing distance of one from the other indicates that the price trend is strong, while a narrowing distance indicates the opposite. When the red MACD line crosses the black, it signals that the strength of a price trend has changed.
MACD generates signals more slowly than the Stochastic. Note that most signals as indicated by the arrows show an attractive potential for profit.
One could say that the RSI indicates when the current trend is "tired" and that a change in direction is imminent. Chronologically, the MACD trigger will often happen after the RSI and Stochastic, providing the signal to act in the market. You can invest a portion of your liquidity using this signal.
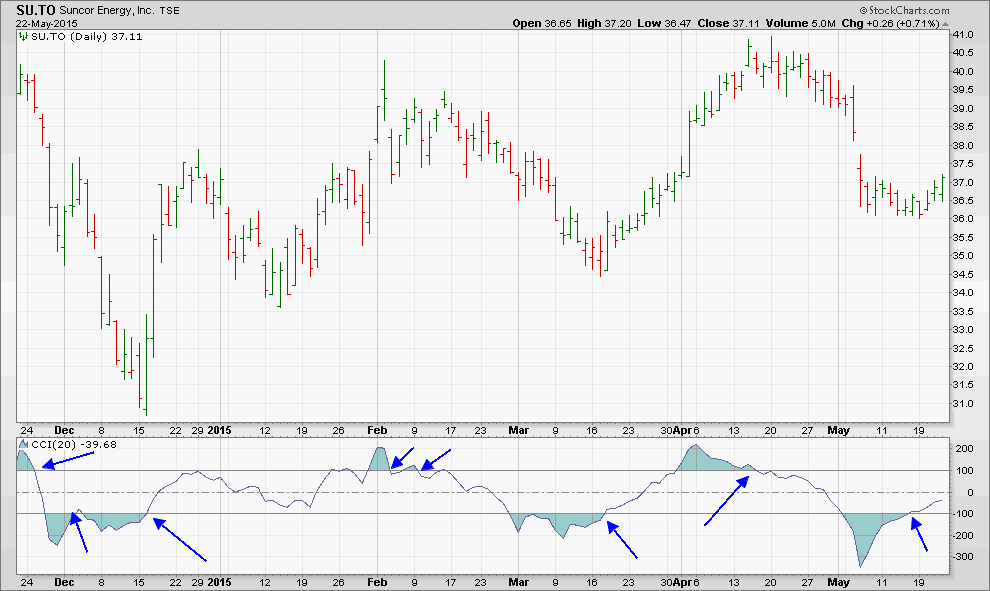
Finally, CCI is an indicator that gives a sell signal when it drops below the 100 level and gives a buy signal when it rises above -100. Its formula is more original than the other indicators because the CCI includes the concept of moving averages, volatility and a daily price that is the average between the high, low and closing of each session. You can invest another portion of your liquidity using this signal.
In reality, nothing is easy and perfect. The four musketeers usually do not give signals simultaneously: the RSI happens first, followed by Stochastic and MACD and eventually CCI. RSI does not always indicate divergences. If a security changes direction quickly and frequently, the MACD can give too many signals. Usually, it is the CCI, which requires less time to analyze of the four, because of its structure. However, it is also slower at generating a signal with a potential for profit. These tools remove the illusion of being able to rely on other theories that establish a link between cause and effect without it any proven logic.
Without the four musketeers, the path to profit can be much more difficult and sometimes deceptive.