Volatility
American elections led to a sharp increase in volatility that affected markets in many countries, not just those in the United States. The term "market volatility" is used to refer to conflicting price movements. High volatility means that the value of investments is changing rapidly with a downward trend. This happens because investors are divided mainly into two opposing and convinced groups: those who think that the market is bullish and those who think it is bearish. When the market climbs, bearish investors sell their stocks because they say that the market is overvalued and that it is a good opportunity to sell. On the other side, bullish investors, even more convinced of being right, find that this market offers a great buying opportunity. When the market falls, bullish investors buy, because they say that the market has become undervalued; and bearish investors, even more convinced of being right, sell. All this leads to sharp price fluctuations that often include "gaps"; a difference between the closing price of a security one day and its high or low the next.
But how is volatility defined? It is the turbulence of prices. In order to characterize it academically, we use standard deviation, which can be explained as follows: we calculate the average price fluctuation during a given time and then analyze price fluctuations around this average which is analogous to the center of the movement of a pendulum: the more the price of each security moves away from this center, the higher its volatility.
For securities that offer options, the Montreal Exchange provides this measure of turbulence, called "historical volatility". For example, at the time of this writing, BCE stock's volatility was 8.44%, while that of CNQ stood at 28.01%. This means that shares of CNQ generally experience much more turbulence than those of BCE. Note that the volatility of a security is not constant. Thus, for CNQ as for BCE, individual volatility fluctuates according to events that affect each, but CNQ stock will likely fluctuate much more than BCE. In other words, the volatility of a security fluctuates, and so we observe a "volatility of volatility".
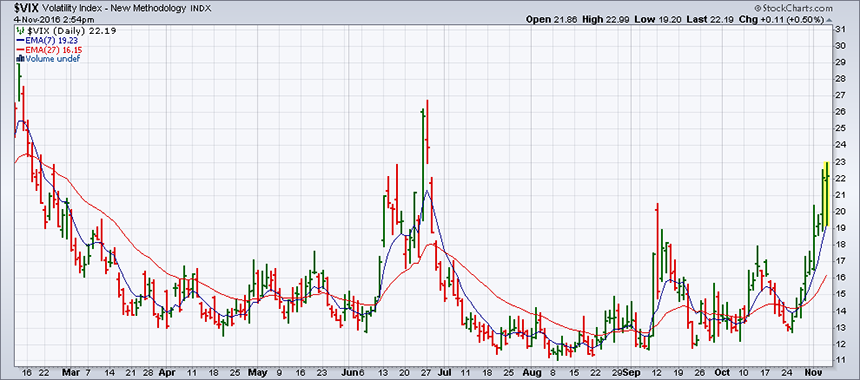
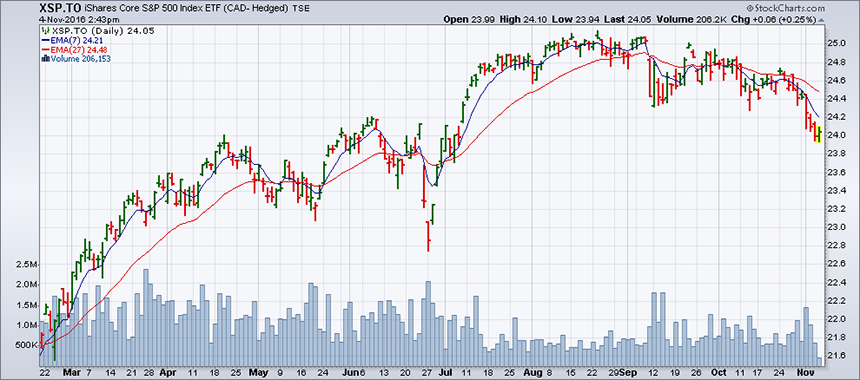
By adding up the volatility of every individual security in a market index, we get general market turbulence. Several indicators that use this global volatility are available to investors, the most popular being the VIX (Volatility Index), established continuously by the CBOE (Chicago Board Options Exchange). The calculation of this volatility indicator doesn't really match that of standard deviation described above. Rather, it is the "time value of call and put options" on the 500 stocks in the S&P 500, but similar results are obtained. Chart 1 shows the VIX with each bar representing a different market session. Note that from late October onward, the VIX rose sharply, reflecting the awaited outcome of the American elections. This swift rise was automatically reflected in prices: Chart 2 shows the SPY; the ETF on the S&P 500 which trades in Canadian dollars in Toronto, under the symbol XSP (Chart 3).
The VIX is also known as the "fear index".
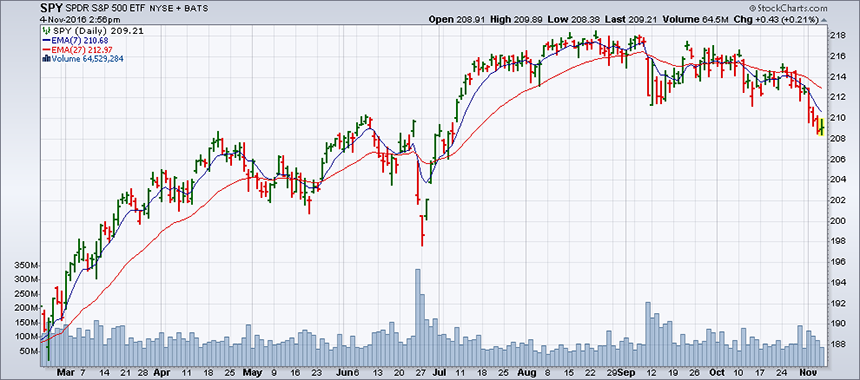
Note that the SPY moves inversely to the VIX: when the VIX rises, the SPY drops and vice versa. This phenomenon does not occur only in a daily chart: it can also occur during a trading session and can be helpful to short term traders to explain very short term price swings.
A rule derived from practice is as follows: when the VIX is above 20%, investors should not trade in the short term as markets often change direction very suddenly.
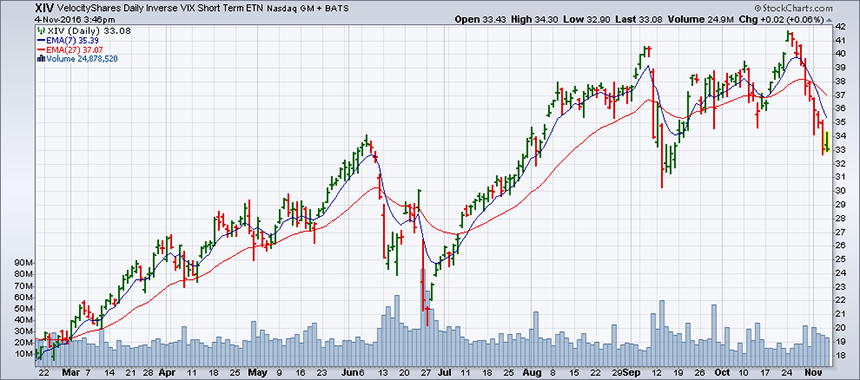
Does a happiness index exist? Of course: it is the opposite of the fear index. Chart 4 shows the XIV, an ETN (Exchange Traded Note, similar to an ETF) that investors can trade. Its chart mimics the VIX. But just as in the market where happiness is the opposite of fear, the XIV chart is the inverse of the VIX. While one would buy the VIX, traded under the symbol VXX, to protect a portfolio against a decline in value, the XIV plays the opposite role: in a rising market, it adds profit to a portfolio.