The Relative Strength Index (RSI)
When talking about the strength of a stock there are a few different interpretations, one of which is the Relative Strength Index (RSI) . The RSI is a comparison between the days that a stock finishes up against the days it finishes down. This indicator is a popular tool in momentum trading.
The RSI is a reasonably simple indicator that anyone can use. It is calculated with the following formula. (Don't worry, most likely, you will never have to do this manually).
![RSI = 100 - [100/(1 + Nup/Ndown)]](/Content/images/BrokerageNotion/technical-analysis12e.jpg)
The RSI ranges from 0 to 100. A stock is considered overbought around the 70 level. This number is not written in stone - in a bull market some believe that 80 is a better level to indicate an overbought stock since stocks often trade at higher valuations during bull markets. Likewise, if the RSI approaches 30 a stock is considered oversold. Again, some make the adjustment to 20 in a bear market .
The shorter number of days used, the more volatile the RSI is and the more often it will hit extremes. A longer term RSI is more rolling and fluctuates a lot less. Different sectors and industries have varying threshold levels when it comes to the RSI. Stocks in some industries will go as high as 75-80 before dropping back and others have a tough time breaking past 70. A good rule is to watch the RSI over the long term (1 year or more) to determine what level the historical RSI has traded at and how the stock reacted when it reached those levels.
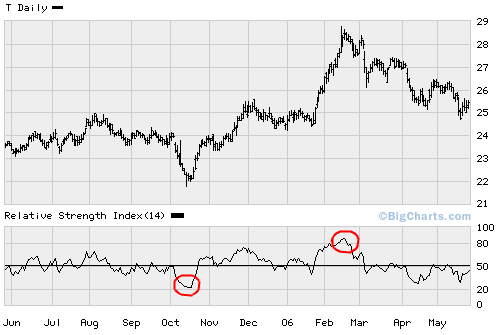
 This chart was supplied by BigCharts.com
Here we have an RSI chart for AT&T. The RSI is displayed in the lower portion of the chart and its scale is the numbers on the right hand side that go from 0 to 100. Notice around October when the RSI dropped almost to 20 the stock climbed up nearly 16% in just six weeks. Also, notice the RSI was approaching the 80-90 level in late February and then the stock (top chart) sold off.
Using moving averages, trendlines, divergence, support, and resistance lines along with the RSI chart can be very useful. Rising bottoms on the RSI chart can produce the same positive trend results as it would on the stock chart. Should the general trend of the stock price tangent from the RSI, it might spark a warningt that the stock is either over/under bought.
The RSI is a great indicator that can help you make the right investment decision. However, beware that big surges and drops in stock price will dramatically affect the RSI, resulting in false buy or sell signals. Most investors agree that the RSI is most effective in "backing up" or increasing confidence before making an investment decision. Therefore, don't invest simply based on the RSI numbers.
