Christopher Columbus and High Yield ETFs
On August 3rd 1492, Christopher Columbus set sail from Spain on three ships headed into the infinite unknown of the Atlantic Ocean. Never before had anyone dared to sail sofar from the coast or west of what ancient civilizations since the time of Odysseus called the Pillars of Hercules. His three vessels, sailing ships of course, were tiny in size and almost ridiculous when compared to ships of today. The largest was 25 meters long, another 17 and the third was 15 meters. Most people in Spain believed that the trip was a mistake, an impossible task, even though the queen herself had funded it. Against all odds, on October 12, 1492, the exhausted sailors aboard the three ships finally arrived at the island now known as San Salvador, the island is the most easterly of the Bahamas. The audacity of Columbus made 1492 a landmark year, that in which Western historiography defined as the boundary between the Middle Ages and the early modern era.
But why such an extraordinary adventure? Columbus had put common sense and experience at the service of an idea in which he firmly believed all along: the Earth was not a flat surface, as most believed, but round. Continuing west, he would finally arrived in China.
As investors, we are like Christopher Columbus. We are sometimes surrounded by people who are convinced that the Earth is flat when we believe it is round. This is the case of junk bond exchange traded funds (ETFs). These ETFs get bad press because they consist of bonds offering excellent yields and thus for many, these can only be candidates for bankruptcy. Others, using common sense and experience, rather call these bond ETFs "high yield". Indeed, there is no monthly maturity that has ever missed a pro-rated coupon payment to "bold" investors since their issuance some years ago.
Interest Rates
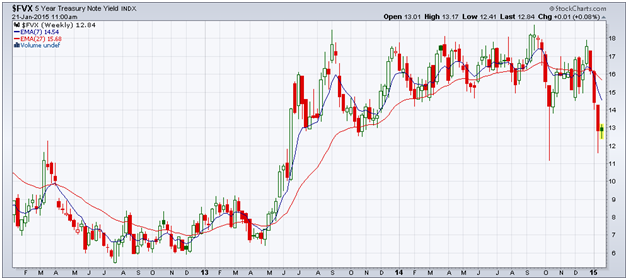
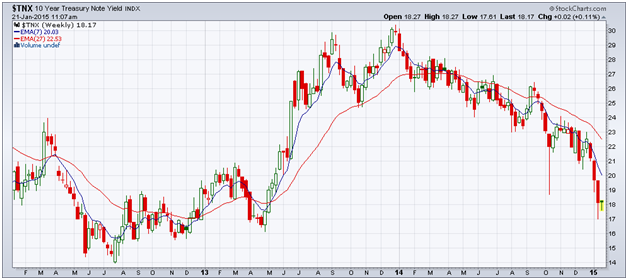
For years, we have talked about interest rates rising and we’ve hardly seen an increase (Chart 1- $FXV - Weekly and Chart 2 - $TNX - Weekly). In Chart 1, we can see that 5 year interest rates rose between May and August 2013, and then stabilize and started dropping since the beginning of 2015. In Chart 2, we see that 10 year rates have risen like 5 year rates. However, since the beginning of 2014, they began to drop. At the time of this writing, it was announced that the Central Bank of Canada lowered interest rates. This is a surprise as we thought we would haveseen the opposite.
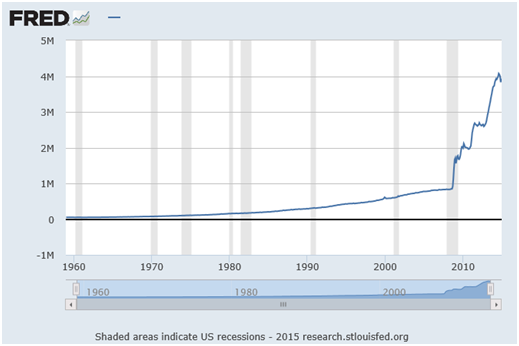
We have no inflation. Contrarily, money supply in the US has grown beyond all previous experience. Chart 3 shows that since five or six years, money supply in the US has increased fivefold (from 800 billion to 4 trillion dollars). This shouldprovoke inflation but we are still very far from seeing this.
 Source: Stockcharts
 Source: Stockcharts
 Source: US Federal Reserve (Saint-Louis)
The HYG US ETF
Canadian investors like to use US market ETFs because their volume is very high and profitable opportunities are greater. Among the most popular interest rate ETFs is the iShares HYG. This ETF is a replica of a composite index (at the time of writing) of 1,009 US corporate bonds. The index is named MarkitiBoxx USD Liquid High Yield Index. The HYG trades on the New York Stock Exchange with an average daily volume of 1.5 million shares traded. The management expense ratio (MER) is 0.50%.
Other features: the Beta is 0.37, which means that this ETF is not very sensitive to movements of the stock market index, such as the S&P500.
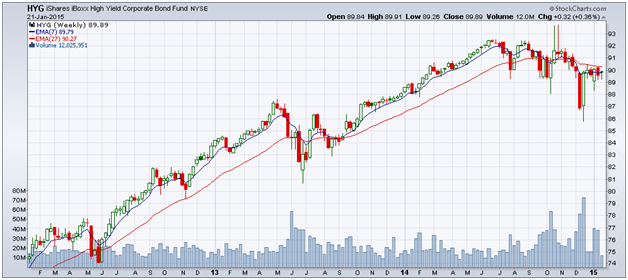
The standard deviation (or 68% of price fluctuations) of this ETF is 5.01%. This means that, over the past three years, prices have fluctuated by 5.01% around its average. For example, if the average price was $100, 5.01% is $5.00. HGY prices have fluctuated, two out of three times (68%) between $105 (= 100 + 5) and $95 (= 100 – 5), which represents a low volatility. Just look at Chart 4 to see this.
The performance of this ETF was 5.70% in the last 12 months, while the yield to maturity (YTM) of the bonds in the index was 6.04% with an average coupon of 6.56%. All this means that investing money in this product would have returned 5.70% net of management fees.
The bonds that make up the index have an average maturity of 4.82 years. This average does not tell us how it is constructed. Is it composed of (A) bonds whose individual maturities are far from the average, for example, 50% with a combined maturity of 8 years and 50% with 2 years to give an average of 5 years? Or for example, (B) 50% bonds with 6 year maturities and 50% with 4 years? This would also give an average of 5 years but the sensitivity of (A) changes in interest rates may significantly differ from that of (B). To satisfy one’s curiosity, investors can simply visit this US ETF’s website, download an Excel list of bonds and inspect the maturities column.
A final aspect to consider is risk. There are two risk factors: (I) the quality of corporate bonds and (II) the sensitivity to changes in interest rates.
- (I) The quality of bonds ultimately means the ability of companies to regularly pay their coupons and to repay the principal at maturity. We usually rely on rating agencies like Standard & Poor, Moody's or Fitch. The bonds of this ETF are rated BBB by S&P which, for corporate bonds, is considered safe. As a reference, only three American companies had the highest AAA (S&P) rating in 2014: Microsoft, Exxon-Mobil and Johnson & Johnson. In Europe, sovereign debts are rated BBB.
- (II) The sensitivity of fluctuations in response to changes in interest rates is called duration. It is not a length in time, but a percentage. For example, in the case of this ETF, the duration is 4.12 years (as shown in its documentation). Academically speaking, it is years, but for the investor’s convenience it should be read as a percentage. This ETF therefore has a duration of 4.12%. If interest rates rise, the value of HYG will decrease (and vice versa). We say that if interest rates rise by 1% the value of the ETF will lose 4.12% of its price (and vice versa). Duration is not always the same: it is high when interest rates are low and the sensitivity decreases when interest rates rise. Therefore, in the current environment where interest rates are low, duration has a greater influence. This means that the risk of holding bonds is higher today compared to several years ago, when rates were 4 or 6%, for example. The HYG (Chart 4) is currently at $89.89, so it should lose about $4.00 if interest rates rise by 1 percentage point.
 Source: Stockcharts
Other High Yield US ETFs
The HYG is obviously not the only high yield ETF with a significant daily trading volume. Below are three others. However, they hold fewer bonds than the HYG: the JNK (MER: 0.40%) is similar to HYG but has an average maturity of 6.41 years; the SJNK (MER: 0.40%) holds bonds with an average maturity of 3.3 years; the HYS (MER: 0.55%) holds bonds with an average maturity of 3.03 years. The shorter the maturity, the less sensitive the ETF is to changes in interest rates.
These ETFs are all labelled "high yield". As mentioned above, a higher yield naturally implies a greater risk. Many negatively call them "junk bonds" ETFs. And that's the difference today, as in the days of Columbus: if I think high yield bond ETFs are composed of junk, I will not buy them. If I believe that these ETFs are composed of high-yield bonds, they become legitimate, even for the most conservative investor. Indeed, the volume of transactions, especially in HYG and JNK is evidence that investor interest in these products is remarkable and widespread. It is hard to believe that the HYG, made from a composite index of over 1,000 BBB rated corporate bonds will become a "junk" bin.
In Canada: XHY and ZHY
In Canada, on the Toronto Stock Exchange we find ETFs that have had the most success in the United States. Canadian issuers assume the CAD/USD exchange rate risk (“CAD-Hedged”). This frees Canadian investors from having to convert their Canadian dollars to USD in order to take a position in these ETFs.
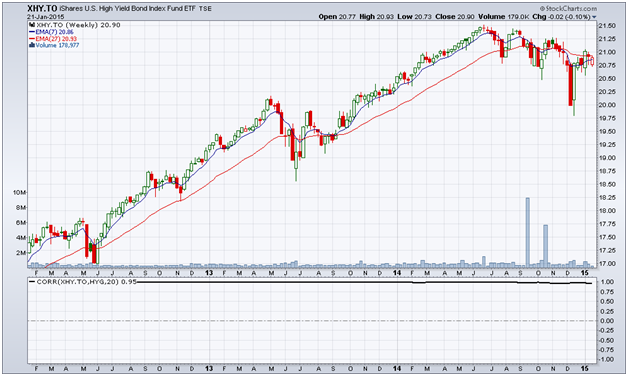
The HYG in Canada is XHY. To prove that its behaviour is the same, we look at the correlation between the two markets. At the bottom of Chart 5 we see a horizontal line that stays at 1.00 over the years. This is the correlation: investing in HYG or XHY offers the same result.
The characteristics of the HYG and XHY are invariably the same, with the exception of the MER (management expense ratio). The MER of XHY is higher than HYG (0.62% vs 0.50%) because it includes CAD/USD exchange rate management.
There is a difference between the price of the shares in the United States and one in Canada: The US share is U$90 and the Canadianone isC$21. It takes several XHY shares to equate to one share of HYG.
 Source: Stockcharts
One important detail: the HYG ETF is composed of a thousand bonds that each pays a coupon every six months. Given the number of bonds and the fact that the coupon payment dates vary from one bond to another, the issuer of that ETF receives payments every day and distributes them to investors each month on a pro-rated basis. This means that investors in the HYG, as in the XHY, receive these coupon payments in their account every month.
Similar to XHY iShares, in Canada there is the ZHY from BMO. The underlying index is not exactly the same, but the basic features are similar. It is up to the investor to decide where to invest, taking into account management fees, daily trading volumes, duration, etc.
Visiting the iShares, BMO and other Canadian issuers’ sites, it is easy to see that high yield ETFs are numerous (see the Toronto Stock Exchange website for a complete list). Again, the choice is based on performance, volume, MERs, duration, etc.
Investors interested in exploring the world of high yield bond ETFs should consult their prospectuses. For Canada, these are found at www.sedar.com and for the United States, at Edgar.