Correlation and the Yo-Yo Principle
After the top, the yo-yo is considered the oldest toy in the world. This instrument, which consists of two rings held together by an axis around which a string is wound, has fairly simple instructions: you attach the end of the string to a finger and you drop the yo-yo, trying to bring it back up and then down again continuously. The string unwinds entirely and when it gets to the end, the yo-yo reverses its direction back up. The reason for this behaviour is found in physics
This toy has been very successful in North America since 1920. It was the Flores Company of California that started production in 1928 with a few dozen yo-yos per day, later increasing production to 300,000 per year and reaching its peak in the 1960s and 1970s, when the yo-yo was fashionable. The Coca-Cola Company even marketed its name by associating it with this toy.
Even today, the yo-yo is a very popular all over the world. International yo-yo competitions are held, where participants use different models whose properties are varied, depending on their skills.
After all, who has not played with a yo-yo at least once in their lives? It is a simple toy that provides the immediate pleasure of success.
Sometimes investors purchase securities, hold them some time and hope that the predicted rise will materialize, thus confirming the correctness of their choice. One may say they play yo-yo with stocks. Playing yo-yo in the stock market is to focus on the success of our individual action on a stock without worrying about anything else. Sometimes it can be dangerous, like crossing a street while focusing on playing, but beware that you could get hit by a car.
How do you play yo-yo with caution? At a minimum look at the correlation between the security you add to your portfolio while waiting for a "rewind" rise and other securities already in the portfolio.
Correlation is based on the past behaviour of a security relative to another. By definition, it is the influence of a one security on another within a given period of time; for example, 20 trading days (four week period), as in the charts below. Mathematically, correlation varies between +1 and -1, going through zero. A correlation of +1 means that two securities move simultaneously in the same direction. In turn, a negative correlation of -1 means that the two securities move inversely to each other. A correlation of zero means that two securities are independent of one another. The latter represents the best portfolio, because no security affects the price of another.
In the case of a correlation of +1, adding a security to the portfolio increases the risk, since it's a bit like investing in only one of the two securities. A portfolio with a correlation of -1 can be considered quite useless because when one stock goes up, the other goes down and the profit from one is offset by the loss of the other (all other conditions being equal).
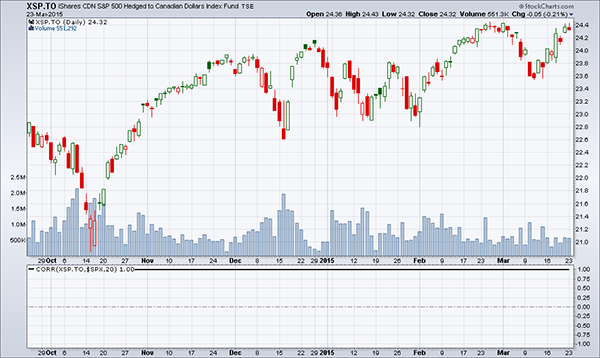
An example of a correlation of +1 is given in Chart 1, which shows the relationship between XSP.TO and $SPX (S&P 500 Index).
 Source: Stockcharts
The XSP.TO is the US S&P 500 ($SPX) an ETF which is traded in Canadian dollars on the TSX. The correlation of +1 is so perfect that we must use an arrow to show the line. The meaning is this: there is no point in buying SPY (the $SPX ETF) and XSP.TO because investing in one is the same as investing in the other. If we want to diversify a portfolio, this is not the way to do it. The chart also shows that the XSP.TO moves exactly like the $SPX, despite the fact that these trade in two different currencies. If the issuer had not done their job hedging the exchange rate, the +1 line would not be perfectly horizontal.
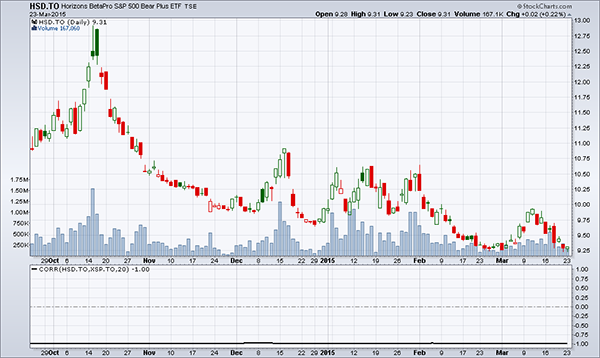
An example of a correlation of -1 is given in Chart 2, which shows the price behaviour of the relationship between the XSP.TO ETF and its inverse, the HSD.TO.
 Source: Stockcharts
Note that the inverse ETF is the perfect opposite of XSP.TO: if one moves up the other goes down and vice versa. Chart 2 of the HSD.TO price is perfectly inverse to XSP.TO, the opposite of what we saw in Chart 1. This reflects the excellent work of the issuer of the HSD.TO.
The negative correlation in Chart 2 shows that if we hold the index in the form of XSP.TO and we want to protect it, despite what we believe to be a brief technical down signal, a way to do so is to purchase its inverse ETF. Warning: inverse ETFs work very well when held for one trading session. So it is necessary, according to the issuer’s recommendation, to sell it each evening and re-buy it the next morning in order for the negative correlation to remain perfect.
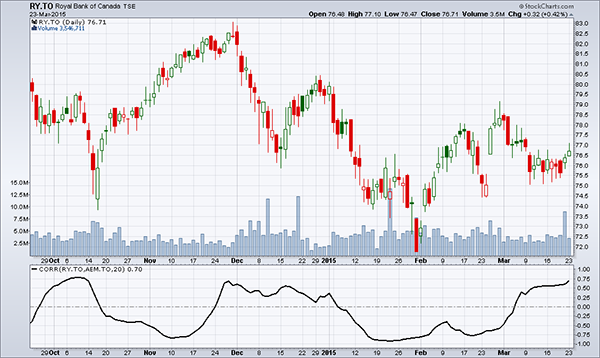
And what about a zero correlation? This is probably the hardest to achieve. Chart 3 shows the correlation between the Royal Bank and a mining stock.
 Source: Stockcharts
Note in Chart 3 that the correlation between the two stocks is rather volatile. On average, we can say that the correlation is zero; but it is never actually zero, sometimes moving from a strong positive correlation to a strong negative correlation. This behaviour indicates that both stocks should be held for an average correlation of zero.
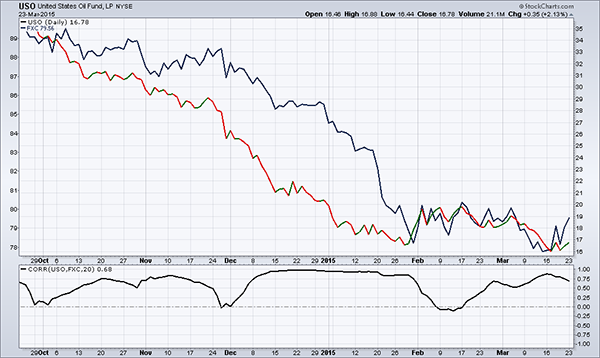
Chart 4 shows the correlation between USO (Oil ETF) and FXC, the CAD/USD exchange rate ETF (how many USD for 1 CAD).
 Source: Stockcharts
Chart 4 shows the behaviour of the two ETF closing prices (top) and the correlation between the two (bottom). Here we get a real sense of the meaning of correlation. In the period between December 2014 and February 2015 the two ETFs decline and the correlation during this time is a perfectly positive 1. This means that if we held the two products in our portfolio in the period shown, we would have lost double. To protect the value of one of the two, we would have had to sell (short) the other or use an inverse ETF, if available.
Correlation, a simple and effective tool, allows us to avoid thinking about a security as an isolated product.
The market offers software that calculates the correlation not only between two securities, but between also more sophisticated portfolios.