Galileo's Telescope and the Teaspoon Approach
On March 12, 1610, Galileo Galilei (known by his French name Galilée), scholar and philosopher of the Italian Renaissance, published a small book in Latin titled The Starry Messenger. This book contained a revolutionary message: Galileo claimed to have evidence that the surface of the moon was not smooth, as had been believed for centuries, but was in fact rough like Earth. He made this discovery by pointing at the moon with his telescope, an invention that Galileo had improved to the point where it enlarged objects by nearly 9 times. A little later, again thanks to the telescope, he also provided evidence that the Earth was not the center of the universe but that it revolved around the sun.
In finance, there is a very interesting tool that is similar to Galileo's telescope, in the sense that it gives us a vision of the reality of prices that we would not so easily see without it. This tool is standard deviation.
Standard deviation is a measure of the dispersion of data around the average (or mean). Taking into account the closing price of a security over a month of trading sessions, we calculate the average price. We then determined the variance between each price and the mean. We mathematically process this data to obtain the standard deviation (the calculation requires that we square each variance, add them all together and divide by the number of prices, then take the square root of this figure). Standard deviation tells us, for example, that two thirds of the prices during the month are within a certain distance relative to the mean. If we take an average price of $20 for Stock X during a given month with a standard deviation of $2, we can say that two thirds of the prices used to determine the average are within the range of $22 to $18 ($20+$2 to $20-$2). The greater the standard deviation, the more a stock is volatile. Standard deviation is a measure derived from past data, but it is used to get a rough idea of potential price movements of a security in the next session.
Before getting into a more concrete example, it is necessary to define certain principles that apply when it comes to statistics. According to the empirical rule for normal distribution, the majority of values will fall within a range centered around the mean, the end points of which are within 3 standard deviations on either side. With this calculation, we can conclude that approximately 68.27% of the values are within one standard deviation of the mean.
We therefore can say that there is 68% (68.27% rounded) probability that the price movement in the next session will be within a defined range. This range is calculated using a certain number of price movements from previous sessions.
Chart 1 shows the SPY US ETF in 2-minute periods. The chart displays a picture of the price movements in one trading session.
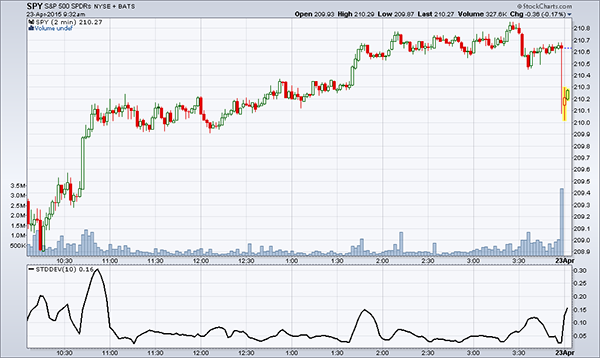 Source: Stockcharts
The standard deviation is displayed in the lower part of Chart 1. On the left, it says "STDDEV (10) 0.16". This means that the standard deviation (STDDEV) as calculated by the computer during the past ten periods (10) was 0.16 points. This standard deviation is based on the behaviour of the last 10 periods of 2 minutes each, and shows that there is 68% probability that the price moves within a price range of 0.16 points. If, for example, the current price of SPY is currently $210.00, there is a 68% chance that the price varies in the next two minutes between $210.16 and $109.84 ($210+$0.16 and $210-$0.16). In other words, there are two chances in three (68%) than the price moves within this range and one chance in three that the price "exits" this range.
In Chart 1, the standard deviation is rather stable during the day, except for the beginning of the session until 10:45am, at 1:45pm and towards the end of the session at 3:30pm. On average, the standard deviation of this session is a very low 0.05 points, indicating a market without uncertainties.
Chart 2 also shows the SPY but in 1-day periods. Notice that the standard deviation is greater: it is 0.78 points on April 23, 2015. However, it is rarely at that level and only for very short periods in the time covered by the chart. On average, one could say that the standard deviation is 1.5 points over a given period, or $1.50 per share. It's not much if we have one share but if we have 1,000 the overall value has a 68% chance of varying by $1,500 per day. The chart also indicates that from March, the standard deviation decreased, reaching its lowest level in the chart on April 23. We must consider standard deviation as a measure of investor uncertainty: note that in April the SPY prices tended to be less nervous and fluctuations are less pronounced. This indicates that the prices seem oriented toward one direction; higher, in this case. Standard deviation reflects this market direction.
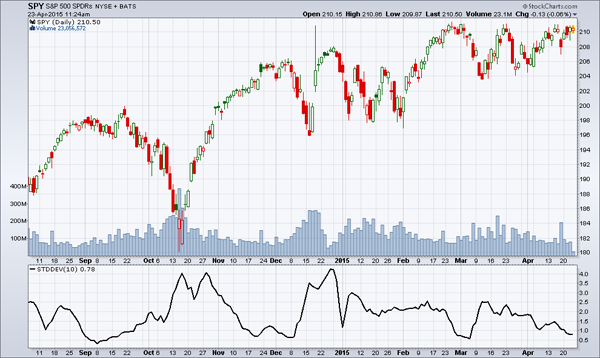 Source: Stockcharts
Naturally, the standard deviation of a higher priced security is greater. In the example of Google, Chart 3 shows a standard deviation at the end of the chart of $5.66, which in itself is very high compared to that of our previous charts. However, it also shows that the price of Google is much higher. To better understand the relationship between the value of standard deviation and security price, simply divide the first by the second. Relative to Google’s price of $553.97, fluctuations indicated by the standard deviation are 1.02% (5.66/553.97). In the case of SPY in Chart 2, the ratio is 0.37% (0.78/210.50). This shows that Google is definitely riskier than the US S&P 500 represented by SPY (as of April 23, 2015).
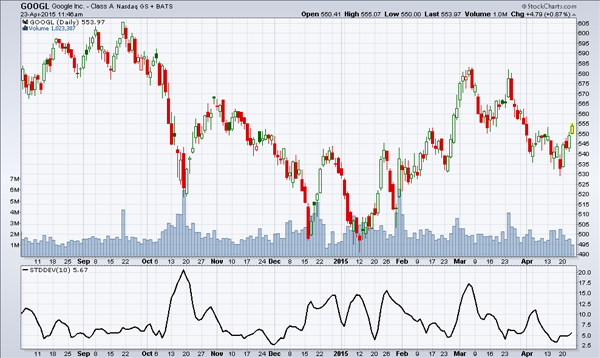 Source: Stockcharts
In conclusion, standard deviation is a useful measure to determine a numerical figure for the fluctuation of a security in the next session, with 68% probability of being right.
One application of this measure is reflected in the Teaspoon Approach, one of my methods for active trading: one enters the market on a technical analysis signal and immediately places an exit order at a price that is within the range of one standard deviation. In principle, we have 68% chance to see our exit order filled. Potentially, we earn less per transaction, but we can enjoy greater peace of mind.
Following this method, we make just one decision based on technical analysis because the exit is based on the increased probability of a gain, regardless of its magnitude: we therefore gain a teaspoonful of money; small, but frequent.