Income ETFs on US indices (Without USD/CAD Exchange Rate Risk)
Chart 1 illustrates the behaviour of the XSP exchange traded fund (ETF) listed on the TSX in Canadian dollars, which replicates the US S&P 500 (the Canadian equivalent of the American SPY ETF, which tracks the US S&P 500). This ETF is a replica of the US stock market and, by direct influence, of the Canadian market at the same time. It is very popular in Canada, as evidenced by the 15 million average shares traded monthly since 2008.
The chart below shows that the XSP was worth $7.00 in March 2009 and has climbed to a peak of $24.39 in July 2015, an increase of 250% in six years. It has since stagnated, showing a worrying inclination for a possible correction, as evidenced by some sudden drops. The first drop took place in August 2015 and the second, in January 2016. Currently, the XSP's overall situation is worrisome: the 27-period moving average (red line) is almost horizontal, which is a negative indication. This pessimism is reinforced by the fact that the CCI (Commodity Channel Index) indicator is approaching negative territory and the Slow Stochastic indicator has fallen below the 80% threshold. In December 2014, the moving average convergence/divergence (MACD) indicator had already given a downtrend signal (see the crossover at 2.62).
 Source: Stockcharts
These technical considerations, based on very credible historic behaviour of these technical analysis tools, cast doubt on the possibility that the market will start to rise in the short-term. Very well monitored and analyzed, the XSP represents and index and as such, an index does not influence all listed securities the same way. One just has to look at the beta of a security to get the idea: the higher the beta, the less autonomous is a security from the movements of the stock market as a whole.
Investors who have the time and interest for analysis may find themselves well-performing and promising stocks or ETF, even if the index is generally negative. For other investors, assuming that the market is stagnant - or even heads lower - the simplest solution to achieve gains would likely be to invest in income ETFs which invest in bonds.
ETFs that are popular with Canadian investors are those traded on the Toronto Stock Exchange in Canadian dollars, but are primarily quoted in the United States. These are therefore US market ETFs (popular in their market) that Canadian ETF issuers offer here in Canadian dollars. It is the Canadian issuer that assumes the exchange rate risk, so that the Canadian investor does not have to worry about the USD/CAD exchange rate. Normally, such a "favour" is free: the issuer does not charge a fee for this conversion service. US ETFs listed in Canada are not all in Canadian dollars. To recognize them, look for key terms like "CAD-hedged" which always accompany the names of these funds. If these are missing, it is best to contact the broker to request more information before investing. Otherwise, investors risk buying a product with Canadian dollars which are converted into US dollars on the day of purchase and converted back on the day of sale. In the latter case, the investor is likely to experience a gain or loss on the ETF as well as a second gain or loss on the exchange rate, incurring two risks instead of one. Table 1 lists nine ETFs that are listed on the Toronto Stock Exchange, which offer protection from the USD/CAD exchange rate. In this list, three issuers (iShares, BMO and PowerShares) compete with each other, as they sometimes offer the same product under different symbols and prices.
| Symbol | ETF Name (CAD-Hedged) with Monthly Income Distributions | 12 Month Return | MER1 | DUR2 |
|---|---|---|---|---|
| BKL | PowerShares Senior Loan Index | 4.85 | 0.82 | n.a. |
| CHB | iShares U.S. High Yield Fixed Income Index Common Class | 7.05 | 0.56 | 4.00 |
| CSD | iShares Advantaged Short Duration High Income Common Class | 5.55 | 0.61 | 9.00 |
| PFH | PowerShares Fundamental High Yield Corporate Bond Index | 4.87 | 0.67 | n.a. |
| XHY | iShares U.S. High Yield Bond Index | 6.94 | 0.67 | 4.00 |
| XIG | iShares U.S. IG Corporate Bond Index | 3.14 | 0.32 | 7.00 |
| ZHY | BMO High Yield US Corporate Bond Index | 7.30 | 0.62 | 4.32 |
| ZMU | BMO Mid-Term US IG Corporate Bond Index | 3.53 | 0.28 | 6.48 |
| ZSU | BMO Short-Term US IG Corporate Bond Index | 2.28 | 0.28 | 2.71 |
1MER: Management Expense Ratio; 2DUR: Duration
Source: Morningstar (February 26, 2016) and issuer fact sheets
This table shows the performance of these ETFs over the past 12 months. Income is pro-rated and distributed monthly on predetermined dates. MER is the ratio of the annual management fees of the ETF.
We should highlight the relationship between return and risk, represented here by the duration (DUR): If interest rates rise or fall by 1%, the price of the funds will vary inversely by this percentage. For example, if interest rates rise by 1%, the price of an ETF with a duration of 9 will fall by 9%. The duration is therefore a measure of risk relative to a change in interest rates.
This is not the only risk. Another risk relates to the quality of the bonds in the index that the ETF tracks (index of corporate bonds). In this case, BBB rated corporate bonds are less risky than those with a C rating (but they also yield less).
In fact, a credit rating agency takes into consideration several risks. One is the risk associated with the field of activity a company is in. For example, think of a company that issued bonds to finance an oil extraction project, which is no longer profitable after a decline in oil prices. This could lead to a downgrade of its bonds, a drop in stock price and consequently, a decline in the overall value of the ETF.
Another risk, again in the case of a company, relates to non-payment of coupons (the source of income for the investor). Generally, the higher the coupon, the greater the risk for the investor. Of course, these ETFs as primary source of return include hundreds of bonds, the risk of non-payment of all bonds at the same time is virtually zero. It is in the investor's interest to visit the issuer's website for more details about these ETFs. Among other things, they will find the quality of bonds held and their structures.
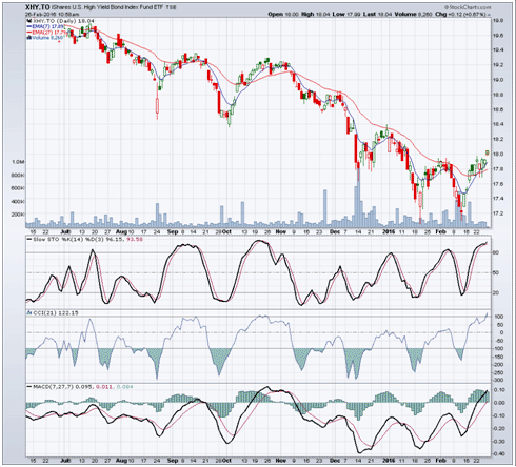 Source: Stockcharts
For example, Chart 2 illustrates the XHY ETF, listed on the Toronto Stock Exchange (also see the previous table). We see a "W" pattern (bullish configuration) to the right of the chart and a positive crossover of the 7, 27 EMAs (exponential moving averages). In this case, the investor who buys this ETF would not only benefit from the coupon yields, but also a possible gain on their investment from a rising price.