The Fight Against Hope in the Market
Since time immemorial, boats have been built with wood, a material vulnerable to water and humidity. That is why the battle for navigators has always been against premature degradation of their boats, caused by various types of rot. This problem has followed traders in search of profits in the commerce of goods between different parts of the globe, constantly putting their enterprises at risk over the years. They somehow fought, with various products, always hoping to extend the life of the ships.
In the market, there is a kind of rot against which we should always fight as an investor. Our capital represents the ship and the rot is the hope that the value of our assets will rebound after a bad investment is held in our portfolio.
Two examples support this analogy. Canada is a large producer and exporter of raw materials. Over the past few years, these products have fallen in value as shown in Chart 1 of oil and Chart 2 of Teck.B, for example.
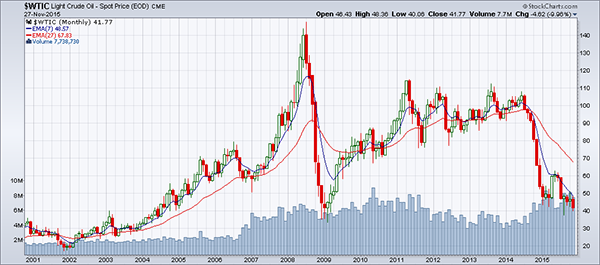 Source : Stockcharts
We see that a decline rarely continues over a long period. It occurs rather by successive waves: the price declines, rebounds, falls below the previous low, bounces less high than the previous high, back again, and so on. During rebounds, investors are tempted to position themselves for a rise, convinced that the decline is over. After their purchase, when the price falls again, they often keep the position and change their original opinion with the hope that sooner or later, the security will prove them right by rebounding. Ultimately, the investor dilutes the risk of their position over time in the hope that the initial error of buying corrects itself.
Teck.B (Chart 2) clearly shows the behaviour of a drop in waves. Since January 4, 2011, we see that the price has fallen continuously but in waves, from an original price of $56.19. Every year since then, it showed a lower bounce than the previous, followed by a lower drop than the previous.
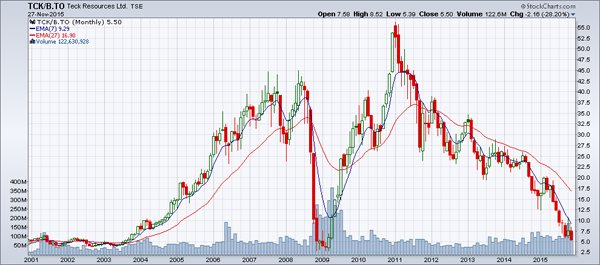 Source : Stockcharts
Chart 3 shows Teck.B weekly. This is an example, including the five illusory purchase points for five investors: A, B, C, D and E.
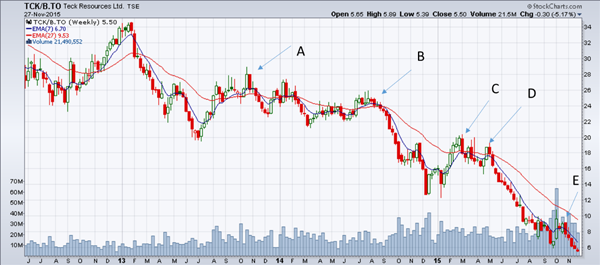 Source : Stockcharts
Investor A, like investors B, C, D and E, has purchased shares of Teck.B because they were certain that the stock would rebound, not only because of the quality of the company, but above all because they believed that raw materials had finally declined enough so that a rebound was imminent. It is easily understandable to believe this. The market is like the ocean: it is there and we use it to navigate. The problem is that the five investors in this example are not yet out of the market, despite the drop. The main reason is hope, that is to say, the desire to dilute risk with time and avoid admitting being wrong. This attitude is an investor's dry rot, which has a severe destructive potential for assets (in this case, less for investor E than investor A).
Here are the losses for the open positions of our five investors on November 30, 2015:
| A | Bought at $28.89 on October 21, 2013 | Price of Teck.B on November 30, 2015: $5.41 |
|---|---|---|
| B | Bought at $25.59 on July 21, 2014 | |
| C | Bought at $20.37 on March 2, 2015 | |
| D | Bought at $19.27 on May 4, 2015 | |
| E | Bought at $9.14 on October 28, 2015 |
The solution is to eliminate the destructive microorganism that is hope by accepting that it is possible to lose money on a transaction: this is part of the hazard of navigation.
In practice, to eliminate hope, one should use two tools that are offered by trading platforms with variations: stop orders and alerts.
The stop order is simple. Let's say an investor buys Teck.B at $20.37 on March 2, 2015. Immediately after, they place an on-stop sell order (valid for several days until execution or until cancelled) below, for example, 2% of the price. In calculating 2% of $20.37, we get $0.41. The stop sell order is $19.96 (= 20.37 - 0.41). If the price drops to that level even once, the stop order is executed and the position is closed. In our example, the investor would be out the same day because the price reached a low of $17.79 after their purchase.
Two main issues of stop orders should be highlighted. First, the exit price is not necessarily the one specified by the investor. A stop order becomes a market order when the stop price has been reached. During a very quick drop, the order could be executed at a price lower than that specified.
As for the second issue, it is assumed that the stop order is public and therefore visible using institutional platforms. Investors interested in buying the same stock on sale at $19.96, while it is trading at $20.37, find the offer generous and attractive. The presence of other similar stop sell orders may cause a drop in prices to the stop level, then an increase once executed. This is a situation that most investors have experienced. In this situation, the stop price should not be too close to the current trading price and the investor should select securities whose normal daily trading volume is high. This way, it becomes less likely for the market to be attracted to stop orders, because investors have other opportunities for profit.
The alert or warning email is an automatic system that replaces the stop order (for the investor who has time to follow the market throughout the day), because it warns that a market exit price has been reached. This allows further reflection before selling at a price that only the investor knows, since the price set for the alert is not an order.
In conclusion, hope is an investor's worst enemy. However, the same way it is possible to fight decay, it is also possible to defeat hope in the market by accepting the possibility of a loss and by exiting positions with a controlled loss that does not jeopardize one's capital.