The Son of Bonacci and the Pygmalion Effect
The name Fibonacci originates from the term “fils de Bonacci “ (“son of Bonacci"). His actual name was Leonard. In the old days, to better identify a person, the place of origin was added to their name. Thus, this person is named Leonard of Pisa (Leonardo da Pisa in Italian), as we say “Leonardo da Vinci” (because he was a native of Vinci) to name the painter and scholar of the Italian Renaissance.
Fibonacci was born around 1170 and died around 1240. Because his father was consul of the Republic of Pisa and had been assigned to represent the Republic in Bougie (a city on the Algerian coast named Bejaïa), he was introduced Hindu-Arabic arithmetic at a young age. This system uses the numbers we know today (0-9), which is much more convenient than the Roman numerals that were used in Pisa and elsewhere.
Fibonacci wrote a book (Liber Abbaci) in which he describes the use of the Hindu-Arabic numerals. In finance, this book is also famous for the solution it provides to one of the problems it sets forth: How many pairs of rabbits will be in an enclosure in which twelve months ago, the first pair of rabbits gave birth each month to a new pair, and each in turn a produced a new pair. The monthly increase in the number of pairs of rabbits is called the "Fibonacci sequence".
This sequence is: 0,1,1,2,3,5,8,13,21,34,55,89,144,233, etc. Each number represents the sum of the previous two. In the very first hand, each number divided by the previous equals 1.62. Each number divided by the precedent of previous equals 2.62. Each number divided by the following number equals 0.62. Each number divided by the second number following equals 0.38.
The most notorious ratio is 1.62: it is called "golden ratio" or "divine ratio". This ratio is attributed to natural properties. The numbers in the series are considered to be numbers found in natural phenomena. Indeed, the number of new branches in a tree and the quantity of seeds of a sunflower are part of these phenomena which seem to follow the numbers in the Fibonacci sequence. The golden ratio is one of harmony: It is considered to represent the ideal proportions of beauty. Thus, an object, the room of a house or a building designed with this ratio will appear more pleasing to an observer than if it were built following any other proportion.
Fibonacci ratios are used in the stock market to identify points that could represent support and resistance in the price of a security, ETF or commodity. Software available to investors generally offer these price correction ratios. Ratios that are usually used are: 61.8%, 50.0% (the ratio of one divided by 2) and 38.2%.
Ratio Applications
When a rising trend gives way to a correction, investors wonder how far the price will decline before taking a break or reversing. According to the qualities attributed to these ratios, the price would make a first stop at 61.8% of the previous increase. Then, if it continued, it would stop at 50% and finally the last step would be at 38.2% of the increase.
When a downward trend gives way to an upward correction, the investor wonders how far the price will go up before pausing or resuming to the downside. According to the qualities attributed to these ratios, the price would make a first stop at 61.8% of the previous decline. Then, if it continued, it would stop at 50% and finally the last step would be at 38.2% of the decline.
Below are examples of downward corrections after an upward trend.
 Source : Stockcharts
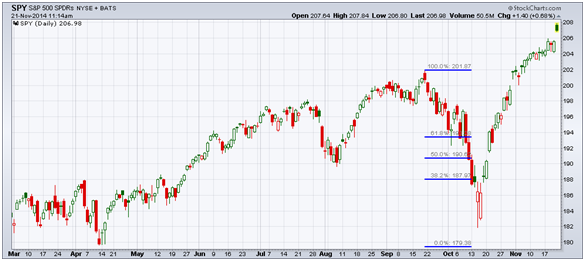
Chart 1 (SPY). The upward trend in this graph starts with the lowest point (mid-April) and ends in mid-September. From the top, the software automatically draws lines that correspond to the three ratios, beginning with the horizontal line at 100% and ending with the line 0.0%, which is at the start of the upward trend. We see that the price reaches three levels and temporarily stops almost perfectly.
 Source : Stockcharts
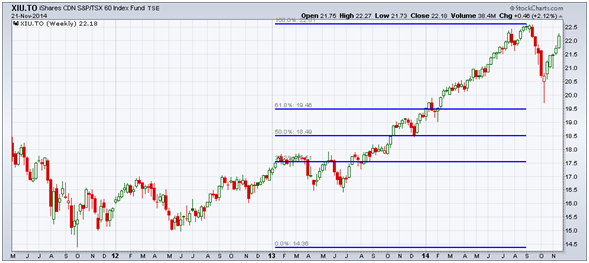
Chart 2 represents a long period extending from the bottom reached in October 2011 to the peak in September 2014. We can see that when the price falls after September 2014, it stopped near the line 61.8%. This represents a support because the price then rebounded to the upside.
 Source : Stockcharts
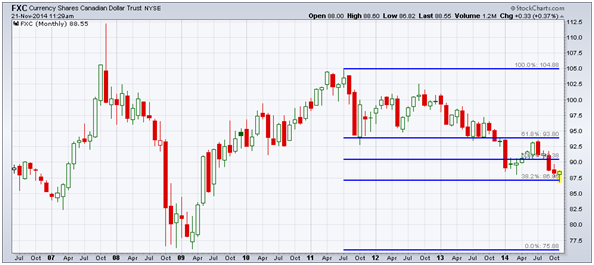
Chart 3 shows the CAD/USD exchange rate (how many USD for one CAD) over a period of about eight years. One can appreciate the accuracy of the support line at 61.8% and that at 38%. The 61.8% line also represents the resistance (or ceiling) of the rebound made by the exchange rate between April and July of 2014.
 Source : Stockcharts
Chart 4 shows the price of gold over 10 years. Here too, there is a fantastic accuracy in the 61.8% and 50% lines: They form the boundaries of the price congestion between April 2013 and November 2014. In principle, if the price goes significantly below the 50% line, the next stop could be at the 38.2% line.
Conclusions
Readers can see from these four examples (and probably other examples they can find themselves with other securities) why "Fibonacci retracements" are popular, especially in institutional portfolio management. Others might simply find that these lines, greatly popularized by their availability in charting software, become valid thanks to the Pygmalion effect, that is to say; by self-fulfilling prophecy.