Emmental Cheese and the Stock Market
Since time immemorial, the region of Emmental in Switzerland produced notorious cheese of the same name. The reason for the "negative spaces" of this cheese is complex and has for long been unknown. Some decades ago, these holes were found to be the result of a combination of three different bacteria. One "ate" the product of the other two and emitted a gas to form these famous cavities. This combination is unique to Emmental cheese since the vast majority of cheeses do not have these characteristics holes. In the official terminology of the Emmental cheese, a hole is called an "eye". So you could say that the cheese in question has open eyes, while other cheeses still have their eyes closed.i
There is a surprising analogy between Emmental cheese and the stock market, at least with regard to open or closed eyes. On the market, an eye is called a "gap". This is a hole or a blank if you will, in the continuity of the price of a trend or congestion.
Figure 1 illustrates different gaps. Each of the four examples is shown over two sessions (yesterday and today): two in a downtrend (A and B) and two in an uptrend (C and D).
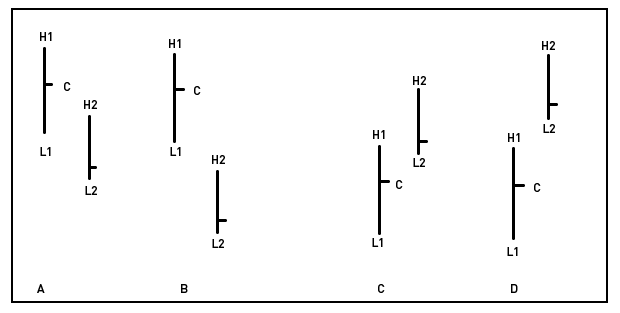
In example A, the gap is between C (yesterday's close) and H2 (today's high). The same applies to gap B. The difference between the two is that gap B is clearly identified in a price chart, while the gap A is rather hidden and is usually ignored.
In example C, a gap is located between C (yesterday's close) and L2 (today's low). The same applies to gap D. The difference between the two is that the gap in D is clearly identified in a price chart, while the gap in C is rather hidden and usually ignored.
Chart 1 of the SPY (the US S&P 500 ETF) shows several gaps. Ten are highlighted below, but they are more than that in reality.
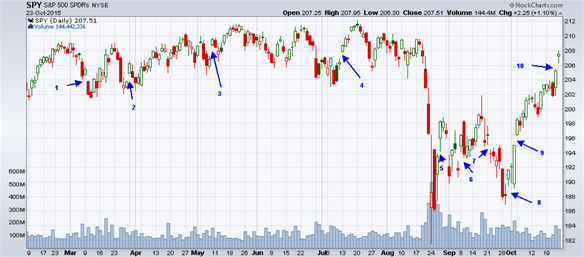 Source : Stockcharts
What is the meaning of a gap in the market? Traditionally, a gap, unlike Emmental cheese, "should" be closed (or "filled") by successive price behavior, but this is not an absolute rule.
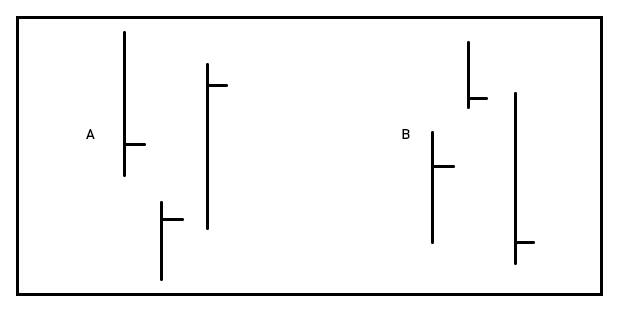
A gap being filled means that the security returns to its previous price behavior to fill the negative space. Figure 2 illustrates three sessions for A and B. While the first two are followed over time (yesterday and today), the third can take place the next day or a few sessions later. In A, you can see a downward gap between the first two sessions. During the third session, the price rises and closes the gap between session 1 and session 2. In B the same behavior can be observed, but in the opposite direction.
In analyzing the behavior of open and closed gaps, it was found decades ago that there are four different situations in which gaps are formed. Therefore, there are four types of negative spaces.
The first type is found during price congestion. Chart 1 shows four gaps between February and August. During the same period, prices are clearly in congestion, that is to say, they oscillate but tread water. Note that each of the four gaps closes shortly thereafter by a return of the price. Congestion gaps practically always close.
The other three types of gaps are found during trends.
Gaps 8 and 9 may be defined as early (upward) trend gaps. These are also called "breakaway gaps", and represent the first type of negative space into a trend. These gaps usually never close. Indeed, the market is so propelled into its new trend that it has no opportunity to retreat for awhile to close the negative spaces.
Gap 10 lends itself to two interpretations. On the one hand, we can consider it as a gap at the start of a trend (it would be the third of gaps 8 and 9) because it occurs at the end of a bullish configuration which forms a "W" between mid-August and early October. On the other hand, it could also be seen as a runaway gap, the second type of negative space within a trend. This type of gap is usually closed in about 50% of cases by subsequent price movements. It all depends on the energy of the trend: if the trend is strong, it will not be closed and if the trend weakens, it will be.
The third trend gap occurs at the end of a trend, when investor indecision is high. This is called an exhaustion gap. We see a series of gaps, each being closed by the prices that follow, and which, in turn, create other gaps. This pattern indicates volatility, as in the case of gaps 5, 6 and 7.
These four categories of gaps are found in all securities and exchange traded funds, regardless of whether a chart uses a bar to indicate one session or a period of two minutes. Their analysis is useful, among other things, because of the very high uniformity of their behaviour.
i Readers interested in this subject have several books at thier disposal, including this one: Paul S. Kindstedt, Cheese and Culture. Chelsea Green Publishing, Vermont (USA), 2012.