La Gioconda's Smile
Five centuries ago, when Leonardo da Vinci painted his famous portrait called "La Gioconda" (portrait of Mona Lisa), he surely didn't anticipate the flood of speculation that this lady's mysterious smile would produce. The mystery surrounding the smile persists to this day. One can contemplate at length this famous painting in the Louvre - or a reproduction - without ever discovering an answer.
In the wonderful world of derivatives, publicly traded options also offer us a smile to admire. However, this smile proves easier to interpret. This "smile" is the implied volatility curve of options.
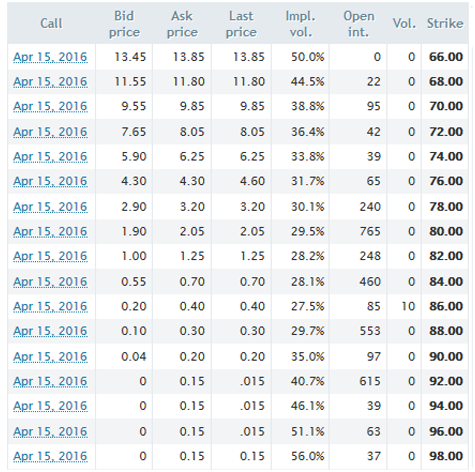
Table 1 provides a list of call options on shares of Dollarama Inc. (DOL.to) at the market close on Thursday, March 24, 2016, when the share price was $79.44. The table shows only part of the options available and no put options. Investors can find a complete list of these options and their implied volatility on the Montreal Exchange website NOTE - This link will open in a new tab..
 Source: Montreal Exchange
Note the "Implied Volatility" column (fifth column from the left) and the "Series" column (last on the right). The "Call" column (1st left) shows the expiry date of the options. We are looking at all call options having the same term and expiring on the third Friday of April, 2016.
- Note that the implied volatility of in-the-money options gradually decreases as the exercise price increases, from 50.0% for the option with a $66 exercise price to 30.1% for the option with an exercise price of $78. The decline continues beyond in-the-money (ITM) options to out-of-the-money (OTM) options.
- Also note that the implied volatility of OTM options increases with the exercise price, from 27.5% for the option with an exercise price of $86 to 56.0% for the one with an exercise price of $98.
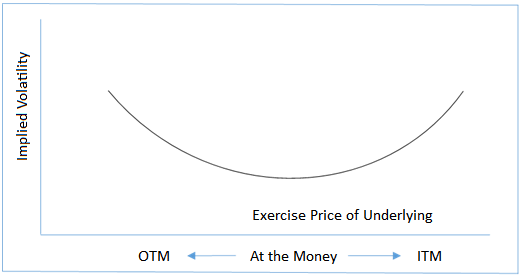
The behaviour of implied volatility of various options on an underlying issue forms the "smile curve" shown in Chart 1 below. This is not always so smooth, as it depicts an average condition. In addition, the "smile" in implied volatility is not always symmetrically distributed like the one in this chart; this is particular to DOL.to. Options for each underlying stock or ETF will have their own "smile" depending on the market, and sometimes that smile is reversed.
What is the significance of this curve? Before you answer, you should understand the implied volatility (IV) of an option:
- It represents the market sentiment about future potential movements of the underlying security.
- High IV reflects the market perception that the underlying stock will experience strong market movements, upward or downward.
- The IV incorporates all market expectations. For example, on the eve of an announcement of quarterly earnings or statistics (unemployment rate, etc.), the IV can increase based on expected results.
- It is used to calculate the probability that an underlying security reaches [in the case of a long trade] or doesn't reach [in the case of a short trade] a price ensuring that the option is profitable within a specified period of time.
- The higher the IV, the higher the premium paid by the investor who wishes to buy an option.
- The IV does not represent a market direction, nor does it hold real predictive power. As it is the result of mathematical formulas, it is theoretical.
- The IV increases when the market declines, so that the curve as a whole is likely to keep the same shape while moving to a higher level on the chart. Similarly, the IV drops during a rising market, so the curve should move to a lower level.
There are three factors in the calculation of probabilities that the underlying security will reach a certain price:
- The difference between the current price of the underlying and the option exercise price.
- The implied volatility of the option.
- The time to option expiration.
Table 2 provides an example of the theoretical probability of DOL.to reaching $82.05 by the expiration of the April 15 2016/$80 call option. The minimum price objective (without profit) is the exercise price ($80) plus the premium ($2.05). The share price of $82.05 is therefore only the breakeven point. Volatility is listed in Table 1, while the number of days to expiration is the difference between March 24 and April 15. We do not take commissions into account.
Note that the call option buyer has just 32.7% probability that the price reaches the breakeven point of $82.05. In other words, the probability that the investor loses their entire premium at maturity is 67.2%.
Table 3 determines how likely it would be to reach breakeven if the implied volatility was hypothetically higher (for example, more than double). Note that the likelihood of success has increased significantly from 29.5% to 42.3%. For an even better probability, it seems intuitive to select a longer term option: for example, 53 days (from 24 March to 15 April, over a month) while maintaining an IV of 68%. In this case, the increase in probability would be a little less than three percent, which results in a success rate of 45%. Investors can verify these calculations for themselves using the free calculator available at the Option Strategist - McMillan Analysis Corp website, which we also used to get the results for our three tables: www.optionstrategist.com/calculators/probability NOTE - This link will open in a new tab..
Table 2
Data Entry
The following values were provided:
Stock price: $79.44
Target price (minimum): $82.05
Calendar days: 22 days
Annual percentage volatility: 29.5%
Results
The probabilities calculated are:
Probability that the stock is greater than the target price: 32.7%
Probability that the stock is less than the target price: 67.2%
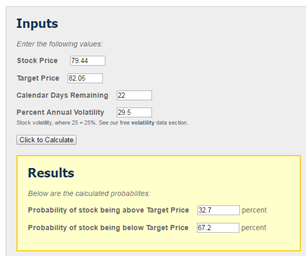
Table 3
Data Entry
The following values were provided:
Stock price: $79.44
Target price (minimum): $82.05
Calendar days: 22 days
Annual percentage volatility: 68%
Results
The probabilities calculated are:
Probability that the stock is greater than the target price: 42.3%
Probability that the stock is less than the target price: 57.6%
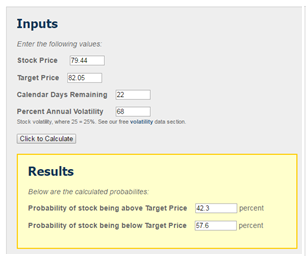
Table 4
Data Entry
The following values were provided:
Stock price: $79.44
Target price (minimum): $80.25
Calendar days: 22 days
Annual percentage volatility: 34%
Results
The probabilities calculated are:
Probability that the stock is greater than the target price: 45.1%
Probability that the stock is less than the target price: 54.8%
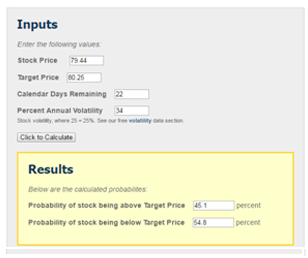
Table 4 shows the probability that the breakeven point is reached by the April 15 2016/$74 option, given a premium of $6.25 and a 34% IV. The breakeven point is composed of the option exercise price ($74) plus the premium ($6.25), to equal $80.25. The calculator indicates a 45% probability of success, which is better than the April 15/$80 option, for which the IV is to 29.5%. Certainly, the premium is higher, but so is the probability of breaking even.
As mentioned earlier, the implied volatility is not directional. That said, given the fact that the decision to purchase an option is based on a technical or fundamental signal whose the probability of success exceeds that of a possible loss, it is normal to intuitively expect the estimated probability of success by the calculator to be higher.
A direct application of the implied volatility smile-shaped curve concerns spread option strategies. For example, consider the purchase of a call option and simultaneous sale of another call option at a different strike price but with the same expiration date. If you choose to buy the option with the lower VI than that of the option you sell, the profit of the strategy is likely to be higher than the opposite scenario.
Here we have reviewed examples relating to call options but the same concepts apply to put options as well.