Stock Buybacks
A company issues shares when it is looking for capital: by buying its shares, investors provide this required capital. These shares are then publicly traded.
This issuance of shares dilutes ownership and earnings per share, and changes the price-earnings ratio, one of the most widespread and most analyzed ratios. For example, if a fictitious share of company AA is worth $20 and its earnings per share is $2, this ratio is 10 ($20/$2). We could then say that it takes the equivalent of 10 years of the latest profits to pay for a share. If company AA increases the number of outstanding shares with a new issue, the profit allocated to each share (the "old" shares + new) decreases, because that same earnings will be spread over a larger number shares. In other words, the share price remains the same and the price-earnings ratio increases. For example, if earnings per share is now $1 because of the new issue, the price-earnings ratio is 20 ($20/$1). We could then say that it takes the equivalent of 20 years of the latest earnings to pay for a share. Obviously the stock is less attractive after the new issue, all other things being equal.
Now, what happens if company AA does the opposite and buys some of the shares that were previously issued?
The purchase of its own shares (a "stock buyback" or "share repurchase") has the inverse effect of an equity issuance: company AA distributes money (owned or borrowed) to investors, who sell their shares back at market price. Reasons for share repurchases are numerous:
- The company permanently removes these shares from the market because it believes its stock is undervalued.
- It keeps these as "treasury" shares, which will provide it with shares to issue for programs such employee compensation without having to create new ones.
- The company can return money to investors, avoiding a dividend distribution. In this case, it is the tax treatment that matters to investors: Is it better to receive dividends or to receive a gain from the sale of shares?
- The company wants to reduce the risk of being a target of hostile bids.
The reason for point 1 lies in the fact that the market cannot be efficient. If the shares are undervalued, the investor who has not sold their shares to the issuer has, in principle, an advantage. In contrast, if the shares are overvalued, investors who keep them are disadvantaged.
In point 2, the share price is fair because the market is considered efficient. The buyback transforms these shares into treasury shares. The latter have different characteristics than shares that investors have bought on the new issues or secondary markets. They do not allow for dividend payments because a company cannot pay itself dividends that it distributes to investors. These shares are non-voting and their number is limited by regulations.
The reasons given in points 3 and 4 speak for themselves.
For company AA, one of the advantages (whether declared or not) of the share repurchase is artificially improved financial ratios. In principle, the company should not engage in this operation for this purpose, but it remains that the ratios do indeed become more attractive.
Table 1 below shows the impact of a stock buyback on the financial results of a company. Imagine a company whose stock is worth $20 that buys two million of its shares at a price of $40 million. See the data in the following table:
| Before Buyback | After Buyback | |
|---|---|---|
| Cash | $50,000,000 | $10,000,000 |
| Equity | $200,000,000 | $160,000,000 |
| Net Profit | $6,000,000 | $6,000,000 |
| Number of Shares Outstanding | 25,000,000 | 23,000,000 |
| 23,000,000 | 25,000,000 | 23,000,000 |
| Return on assets (ROA) | 3% ($6,000,000/$200,000,000) | 3.75% ($6,000,000/$160,000,000) |
| Earnings Per Share | $0.24 ($6,000,000/25,000,000) | $0.26 ( $6,000,000/$23,000,000) |
| Price-Earnings Ratio | 83 ($20/$0.24) | 77 ($20/$0.26) |
We see that after the stock buyback, the price-earnings ratio is lower (77 versus 83), which is usually considered good, since earnings per share increased from $0.24 to $0.26.
The return on assets showed a significant increase after the stock buyback, which is also seen as a good indication.
Note however that this improvement of data and ratios is not the result of the company's better performance.
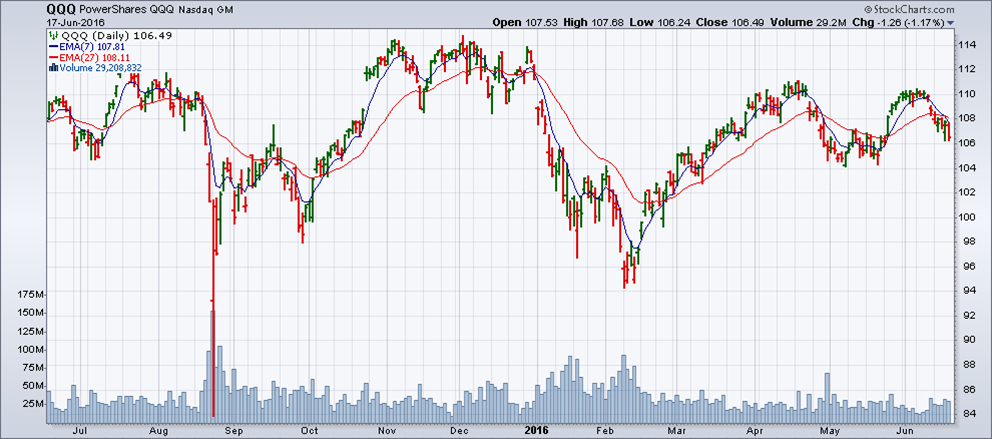
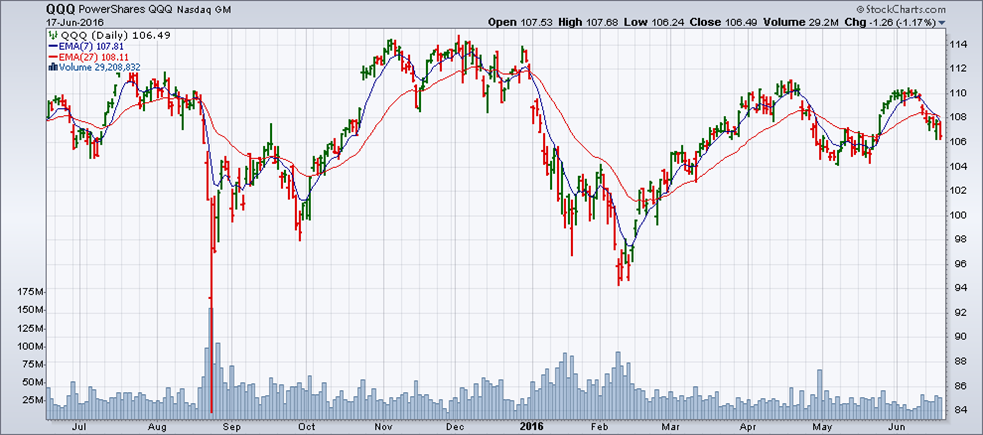
What effect does a stock buyback have on the market performance of a stock? The charts below illustrate the movements of two indices of securities of companies that, over the last twelve months, have bought back their shares (usually 5% or more) compared to the general market index.
Chart 1 shows the US Nasdaq 100, the market "moon" when compared to the S&P 500, which is the "sun" of North American markets, which is to say that it is the index around which most securities and ETFs "gravitate".
The question is the following: Is the performance of an index of companies that have repurchased their shares during the last twelve months different from that of the S&P 500, Nasdaq or similar indices?
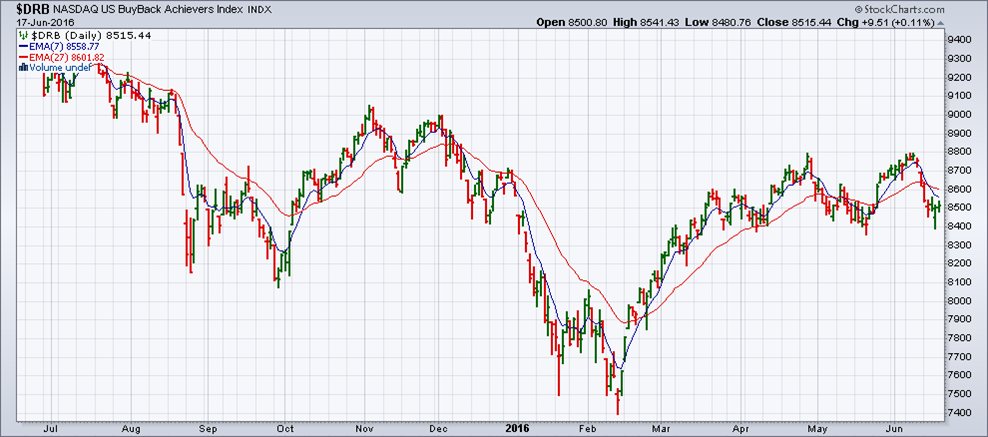
Comparing Charts 1 and 2 – the latter representing the DRB Index ETF of Nasdaq securities which repurchased at least 5% of their shares during the last 12 months - we do not see a significant difference. It is possible that the extents of movements (vertical scale) vary but on the whole, Chart 2 is very similar to Chart 1.
Below is the Canadian S&P/TSX60 Index (Chart 3), represented by its ETF (XIU) and Chart 4, which shows the performance of companies that have bought back shares in the last 12 months, as expressed by the TXBB (Chart 4).
The similarities between the index and the TXBB are less prominent in the Canadian market. This is due in part to the fact that the S&P/TSX60 Index includes a more heterogeneous mix of companies than the QQQ 100 index, so the share repurchase approach is not the same.
 Source: TMX Money
Ultimately we find that the impact of share buybacks on the price behavior of the DBR and TXBB ETFs and indices is rather relative. Nevertheless, the existence of these indices (as well as others which are not discussed here) and the fact that similar indices on stock buybacks exist in Europe and other continents demonstrates the importance of the stock buyback phenomenon.
If this topic interests you, visit the us.spindices.com NOTE - This link will open in a new tab. website, which periodically provides information on share repurchase activity in the United States. For the Canadian market, there is the S&P/TSX Composite Buyback Index (TXBB), which includes the 50 Canadian companies that have had the highest level of share repurchases during the past 12 months. This index represents the ratio between the dollar value paid for common stock buybacks and the total common stock capitalization of the company.